Monday, February 20, 2017


Visual Studio versus R Studio


SQL Server 2016 introduced support for the R language and an integrated R server.  For the first time, many Microsoft developers are looking at R programming.  One of the first questions raised is “which integrated development environment (IDE) should I use?”  Many will be relieved to learn that there is a Visual Studio extension called R Tools for Visual Studio (RTVS) that supports the R language.  However, there is another popular IDE called RStudio.  Both products are free and open source.  This leaves the question, which one should I use? Which is better? Better is a relative term since it begs the question, for what?  In this article, we will discuss the strengths and weakness of each.  Where possible, the evaluation is objective but I feel I would be remiss if I did not offer my assessment as well.  Bear in mind, both platforms are under constant change so the information here will become dated. 

R Tools for Visual Studio


The screen shot below shows an R project open in R Tools for Visual Studio (RTVS).  We can see that this is a robust tool with many features.  Note: Integrated visualizations is a new concept to Visual Studio.  The left panel shows an R script in the editor.  Multiple scripts can be edited simultaneously.  The upper middle window shows a new feature, the SQL query editor where queries can be created and executed.  Below this is the output window which shows the SQL query results.  To the right, we see the plot windows.  The plot scrolling list on the right margin supports browsing plot history.  Note:  There are more optional tabs and windows that are not displayed. 

R Tools for Visual Studio Screen


RStudio

The screen shot below shows a typical RStudio session.  The upper left quadrant is where scripts are edited.  Each tab is a separate script. Below this is the R console where the scripts execute and output is displayed. The upper right quadrant show the workspace, which shows all objects in memory.  The hidden History tab stores a list of all the R statements executed in the session.  Below this is the Plots tab which shows the most recent visualization.  The Files tab (hidden) shows a list of files in the current folder.  The Packages tab (hidden) shows a list of all installed packages.  The Help window provides some quick links to documentation and is where requests for help are displayed.  Note:  All the features shown are also available in RTVS but the settings used for that screen shot did not display them all. 

RStudio Screen


Decision Summary


Visual Studio with RTVS and RStudio are competitive in terms of features thanks to Microsoft’s quick enhancements in recent months. However, as of this writing, RTVS is still not considered a production release.  Therefore, the decision of which IDE to use needs to be made with an eye towards the future.  However, Microsoft’s first preview of RTVS was in March 2016 and by October of the same year had five releases each with substantial improvements.  With that in mind, differences tend to focus on the strengths of the platform, i.e. RTVS has extra features specific to Windows, .Net, and multiple languages while RStudio supports features that favor RStudio products such as integrated deployment of Shiny apps to Shinyapps.IO server and RMarkdown documents to RPubs which are both owned by RStudio.  If you are a developer familiar with Visual Studio using the Microsoft stack or do work with multiple languages, RTVS is probably a good choice.  Microsoft is likely to continue adding functionality to integrate RTVS with tools like SQL Server, .Net, Office, SharePoint, and Azure.  Visual Studio’s powerful development and deployment features together with continuously improving R support, makes this a good choice overall.  However, if you are a data scientist or a developer focused solely on R, RStudio may be the better choice.  RStudio’s interface is simpler and more intuitive which is partly because everything is focused on R.  RStudio has outstanding support for document publishing to virtually any output format.  Creating a slide presentation, an article, a book, or even a web application is simple and immediately viewable within RStudio.  Many, if not most, books on the R language were completely written and published with RStudio.  With a click of a button, you can deploy your files to a free web server as long as the resource demands fall within limits.    If you are still not sure which IDE is best for you, read on to get more details that may help you make your decision.

 Features


RStudio and RTVS are both robust products with many features.  To discuss these, we’ll start out with a list of features that each product supports.  Below is a table listing key product features.  


RTVS feels like a professional development platform as one would expect.  The extensive tools for performance testing, environment analysis, deployment, etc. betray the fact that this is a development platform first, data science tool second.  For example, debugging is well supported and Microsoft has committed to making debugging a first-class feature.  Many languages including Python, C, C++, C#, and Java are supported making Visual Studio a powerful yet complex tool.  RStudio comes from the data science world where publishing your work is critical. It has superb and easy to use publishing features that developers often overlook.  With a few mouse clicks (and a bit of text formatting), your R script becomes a slide show.  The company RStudio has authored many popular R packages including dplyr, ggplot2, and shiny.   RStudio quickly implements support for new data science related features such as R Notebooks.  It seems likely that integrated support for RStudio packages will come first to RStudio.   Overall, RStudio does a better job supporting the iterative data exploration required by data science. 


Features Specific to RStudio

Feature
Manipulate package that supports interactive widgets like drop downs and sliders to manipulate plots interactively.
Excellent documentation.  RTVS still has minimal documentation which made even doing this comparison a challenge.
Is in production release status.  RTVS is not at the time of this writing. 
Documentation and training materials – excellent and extensive
Easy click to deploy R Markdown or Shiny apps to free web server.
Support for R Presentations which tie several publishing features together for ease of use.
Wizard to import data from completive format such as SAS and SPSS.
Wizard to locate and install new packages.
32 and 64 bit versions of R supported.  RTVS only supports 64 bit.
Support for multiple platforms: Linux, Apple OS, Windows, OSX.  RTVS is available on where Visual Studio can run which admittedly is expanding.


Pros to RTVS

In general R Studio has more features than RTVS.  Microsoft admits this on their RTVS download site at: http://microsoft.github.io/RTVS-docs/.  Specifically, they said “RStudio is a fantastic and mature IDE for R that’s been under development for years. RTVS is a long way from RStudio, because we’ve only been developing it since July, 2015. We hope to have all the critical features that you need to be successful this summer.   It’s a fair point.  Considering the short time in which they developed RTVS, it is amazing it supports so many features.  No doubt, Microsoft will continue to improve RTVS but RStudio is also improving their product. 

Beyond raw features, there are some good reasons to prefer Visual Studio.  A list of some of these are:
  • Already trained in Visual Studio.
  • One IDE for multiple platforms and languages.
  • Expectation of ongoing improvements in support for SQL Server R Integration features.
  • Helpful if you need to integrate R programs with other languages such as Python or C#.
  • Commercial product support.
Developers are not always aware of a difference between data science and programming.  Data science is an iterative trial and error process of analysis, research, data wrangling, and experimentation.  Programming is the process of taking a set of requirements and automating them.  RStudio has better support for the prior while Visual Studio is designed for the later.  In other words, the data scientist will analyze data to build a model which has business value but is not necessarily scalable nor generalized.  To enable the enterprise to get the value from this work, it needs to be operationalized, i.e. cleaned up, redesigned for performance, perhaps moved into SQL Server, and automated perhaps via a job scheduler.  In the long term, Visual Studio may be the better choice for this operationalization.  Currently, I think both IDEs can be used with SQL Server/R integration quite well.

Pros of R Studio

R Studio has all the features of RTVS in terms of the R language but is limited to the R language only.  If you want to program in multiple languages in the same IDE, RTVS is the only choice.  However, the focus on R allows R Studio to fully support the language in a very intuitive way.  In fact, the intangible aspect of intuitiveness is the best reason to choose RStudio.  This is where my opinion comes into play so others may disagree.  I find RStudio’s features are right where you expect them to be, out on top and easy to find.  Just click the Preview button to view your Markdown document as a slide show and then publish to the server with a single button click.    Within minutes of installing RStudio I could fully use the IDE whereas I found RTVS less intuitive.  Many features are not obvious and it took time to figure out how to do things and there is scant documentation.  RStudio was designed to do exactly what it does, support data science.  Visual Studio was not designed for this but tools were added in.  An example of this came when I tried to use a document type called an R Notebook.  This is a special interactive format where output is rendered in stream right in the editor. It was inspired by the Jupyter Notebook project.  To get an idea of what I mean see the screen shot below.

R Notebook


The above script is in a special format called R Markdown, hence the Rmd file extension.  The code between the ```r and ``` is called a code chunk and its output is rendered within the editor.  This creates a documentation flow very useful to data scientists and teachers, i.e. they can show their work in real time.  The code chunk can be edited and re-executed causing the plot to refresh.  RTVS does not support R Notebooks.

Beyond the notebook functionality, R Studio has amazing publication support.  An R markdown script can be presented as a slide show, paginated, or flowing text, and converted into many formats including Word, PDF, and HTML.  Many books on the R language were completely written and published from RStudio.  To give an idea of how extensive publishing support is in RStudio, consider the screen show below.  We can see new files of many types supported including R Presentation, R HTML, R Markdown, and R Sweave, which are all aimed as publishing. 


Publishing
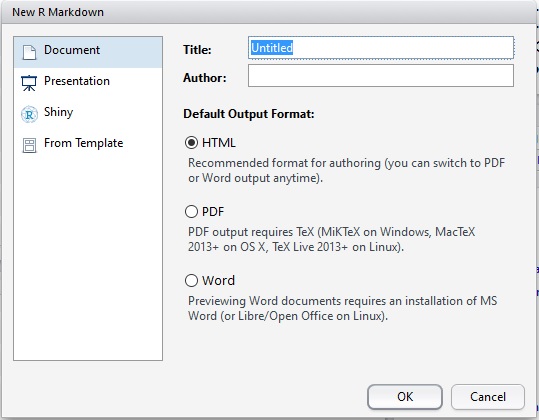
If we select R Markdown from the above list, we are presented with several options.  We can choose HTML, PDF, Word (which RTVS also supports) but we also can choose Presentation and Shiny which gives us more options.  


If we choose R Presentation, we can further choose among several options as we can see in the screen shot below.  This is very handy when you need to create a slide show that incorporates dynamic code execution. 


RStudio even supports creating a file from a template as shown below. 


The support for document publishing is important but I think less appreciated by developers than data scientists.  For teaching, it is invaluable.  I no longer need to create a PowerPoint slide show from my R code.  Being able to maintain it all in one file is a godsend to a speaker.  This is also useful to prepare a presentation to managers and colleagues explaining how you arrived as your data analysis and conclusions.  For research, it means you can send your R project directly to professional journals, in fact most expect this format.

Shiny

Programmers like shiny things hence the name Shiny for R Studio’s interactive web application support for R.  Think of it as server side R scripting pages much as C# supports Active Server Pages (ASP) and Java support Java Server Pages (JSP).  When you run code than include the Shiny package, R Studio launches an R web service to support interactive R applications.  Shiny is an extensive framework with many functions to support interactive widgets.  You can develop and test your Shiny application on your machine and deploy it to a cloud based Shiny server to make it available for others to use.  For a modest Shiny application, the Shiny server is free but you can pay for commercial scale support if desired. 
Both RTVS and RStudio support Shiny (R web pages) but I think RStudio has better support. First, it has better integration. Second, it has wizards to easily deploy your app to a free web server.  Third, RStudio can render Shiny apps within the IDE.  The screen show below is an example of a Shiny app.

Conclusion

R Studio and RTVS are moving targets and you will need to monitor the progress of each as time goes on.  This article covers highlights of the tools but is not exhaustive.  RTVS is rapidly expanding its features but I think the main point to consider is the direction of those features.  Clearly, integration with the Microsoft stack and Azure will be a high priority.  Features to support operationalizing R programs are on the horizon and Microsoft is at the forefront with identifying and supporting this need.  However, if you are not on board with the Microsoft ecosystem, support for other tools such as Amazon Web Services, Shiny.IO, Shiny Server, Oracle, Jupyter Notebooks (versus Azure ML notebooks), etc.  may be slow in coming.  Visual Studio does support open source products such as MySQL, PostgreSQL, Hadoop, Spark, and Python. RStudio is likely to continue focusing on data science features as it has been doing since its founding.  Better support for interactive visualizations, dynamic code, and data wrangling, can be expected.

Monday, March 14, 2016

Using Data Frames in R


Like most scripting languages, R has the ability to import data from a CSV (comma separated) file.  A nice feature is that it will automatically load the data into a data.frame object which means it can be easily be manipulated.

Let's walk through a simple example on how to do this.

The data file we are going to load, storesales.csv, has the contents below.

StoreID,City,State,Year,Sales
1,"Providence","RI",2015,1200000.00
2,"Boston","MA",2015,4000000.00
3,"Bangor","ME",2015,2300000.00
4,"Portsmouth","NH",2015,1200000.00


To avoid hard coding the file path, we can use the  Sys.getenv function to build our file path in a way that will work for any user.   Note:  The # character marks a comment, an ignored line used to document your code.  paste is a function used to concatenate strings but it puts space between each parameter.  paste0 does not add a space between the strings.


#  Load a CSV file into a data frame...

# paste() adds a space between each parameter but paste0 does not...
samplepath = paste0(Sys.getenv("HOMEDRIVE"), Sys.getenv("HOMEPATH"), "\\Documents\\")


Like BASH and PowerShell, R always points to a working folder.  The setwd function which stands for set working directory points R to the path specified in the function parameter as shown below.  The getwd which stands for get working directory will confirm we are pointing to the correct folder, i.e. it will display the folder path.
 
# Use forward slash as separator to avoid needed double backslash (escape sequence)
setwd(samplepath)


# Confirm we are in the right folder...
getwd()


Which displays...
 
[1] "C:/Users/BryanCafferky/Documents"


Now the fun part.  Let's load the simple CSV file into a variable name mydata.

# Load the data...
mydata <- read.csv("storesales.csv")  # read csv file 


After the line above has loaded the file, we can confirm it is indeed a data.frame class by using the class function and passing the variable mydata as the parameter. 
 # Confirm this was returned as a data.frame...
class(mydata)


Which shows it is a data.frame...

[1] "data.frame"


If a variable name is on a line by itself, R automatically displays it's contents much as PowerShell does.  Let's display mydata.

# Display the data...
mydata


We should see the data below...

  StoreID       City State Year   Sales
1       1 Providence    RI 2015 1200000
2       2     Boston    MA 2015 4000000
3       3     Bangor    ME 2015 2300000
4       4 Portsmouth    NH 2015 1200000


Let's play with accessing the data.frame by using its indexes, i.e. the row number and column number.  To display the element at row 2, column 3, we would enter the statement below.

# We can access data by using the subscript (row and column)

# Get row 2, column 3...
mydata[2,3]


We see the values below.

[1] MA
Levels: MA ME NH RI

What happened? What are levels? Good question. When strings are loaded into a data.frame, R automatically converts them to a factor. A factor is something that R is assuming you will want to sort and group by, i.e. like a dimension attribute, so it indexes the string and stores a distinct list of values for it. This enhances performance if R is correct about how you want to use the string. Notice, R displayed the value we asked for but also all the distinct values for State. Internally, R replaces the string with an integer so it is really like the concept of an enumeration.  Ok, so an enumeration is just a fancy word for numeric codes standing for string values, i.e. 1 = Active, 2 = Cancelled, 3 = Not Started.  Can you stop R from doing this string conversion? Yes. And I will discuss how in another blog. Hey, I gotta keep you coming back, right? 


If we include the comma separator but omit the second parameter, i.e. the column index, we will get all the columns for the row numbers specified.  Below we should see all of the columns in row 2 returned.
 
# Get row 2...
mydata[2,]


  StoreID   City State Year Sales
2       2 Boston    MA 2015 4e+06


Now let's display the third column for all rows.


# Get column 3...
mydata[,3]


[1] RI MA ME NH
Levels: MA ME NH RI

A novelty of R is that when you extract data from a class such as a matrix or a data.frame, it does not always return the same type back.  In this case, R returned a vector, i.e. a one dimensional array. Let's prove it by using the class function again.  Note:  This behavior can be important in a function so you probably want to test the return types.


class(mydata[,3])
 
[1] "factor"
 
We got factor which is a base type, i.e. this is a vector of type factor.

Since R is a statistical language, let's get some statitics on mydata with the summary function.

# Get stats on the data...
summary(mydata) 


   StoreID             City   State       Year          Sales        
 Min.   :1.00   Bangor    :1   MA:1   Min.   :2015   Min.   :1200000  
 1st Qu.:1.75   Boston    :1   ME:1   1st Qu.:2015   1st Qu.:1200000  
 Median :2.50   Portsmouth:1   NH:1   Median :2015   Median :1750000  
 Mean   :2.50   Providence:1   RI:1   Mean   :2015   Mean   :2175000  
 3rd Qu.:3.25                         3rd Qu.:2015   3rd Qu.:2725000  
 Max.   :4.00                         Max.   :2015   Max.   :4000000  

So we covered a lot of ground here.  We learned about the data.frame, accessing data by indexes, factors, vectors, and got a flavor of why R is such a good statistical language.  

Oh and sorry, I should have warned you this blog is rated R.  :-

Wednesday, December 23, 2015

Cool things about the R Programming Language

As a BI Consultant, I've been hearing about the R programming language used in analytics but put off actually learning it.  Then I saw a book on R and decided the time had come to finally delve in.  Here are a couple of thoughts I would like to share.

Ah, It's a Scripting Language - Whew!

The first thing I discovered is that R is a scripting language like PowerShell, BASH, Perl, and Python to name a few.  This was a relief for me as I have done a lot of work with PowerShell so the semantics of R would be familiar.  Actually, as I learned about R, I became convinced that Microsoft got some of its PowerShell ideas from R.  For example, R has a command line interpreter called the CLI and an integrated scripting environment (ISE) just as PowerShell does. In fact, I found the R ISE called R Studio to be very similar to the PowerShell ISE.   As a scripting language, R is designed to be very interactive so working one line at a time can be very effective for some tasks whereas scripts are suited to repeatable automated work.

You can get the base R language CLI for Windows at https://cran.r-project.org/bin/windows/base/
RStudio for Windows can be downloaded from https://www.rstudio.com/products/rstudio/download/


All Variables are Arrays

The thing I find the most interesting about R is that all variables are arrays.  Ok, to be more correct, I should say object collections.  However, R distinguishes different types of collections.  A single dimensional array of a data type  is called a vector.  Even if only one value is stored, it is a one dimensional array.  A two dimensional array of the same data type is called a matrix, i.e. just a grid.  What R actually calls arrays are what most languages would consider arrays with three or more dimensions.  It is important to bear in mind, these are all classes, not simple data types, and we can check on the class name using the class function as shown below.

> myvect = 1:10
> 
> class(myvect)
[1] "integer"
 
The first line above creates a vector (single dimension array) named myvect and initializes it with with element values 1 through 10. The second line is asking for the variable type. Note: Like PowerShell, any variable on a line by itself will be displayed as shown below.

 
> myvect
 [1]  1  2  3  4  5  6  7  8  9 10


For analysis, we need complex types and R has them. A List is basically a vector that can hold multiple data types. A data frame is a list of lists, i.e. much like a record set or query result set. There are more powerful classes such as data.table available through R extensions called packages. More on that in another blog.


Operations Work Automatically on the Elements of the Arrays

A fascinating feature and probably one of the reasons R is such a powerful statistical analysis tool is that operations you perform on array variables automatically get applied to the array elements.  For example...

myvect * 2
 [1]  2  4  6  8 10 12 14 16 18 20
 
 
Above, by multiplying the vector variable by 2, every element is multiplied by 2. The same happens with other operations and we can use a function called lapply to have a custom function applied to the entire vector as shown below. 

> myfunct <- function (x)  { x / 2 }
> 
> lapply(myvect, myfunct)
[[1]]
[1] 0.5

[[2]]
[1] 1

[[3]]
[1] 1.5

[[4]]
[1] 2

[[5]]
[1] 2.5
 
 
Above is a partial listing.  Note:  Creating a function looks more like assigning a variable to the function code.  Above, the funcion myfunct is being called iteratively for each element in the vector myvect.  As you learn more about R, you realize that array processing, or again more correctly, collection processing, is at the heart of the language.  
 

Summary


This was just to give you a flavor of R with a couple of key take-a-ways.  One, if you are familiar with a scripting language, you have a jump on R programming.  Two, R is designed to work with object collections.  Cubes conceptually work with data in N dimensional arrays.  I think that conceptual approach serves well for R too.   

Sunday, December 13, 2015

In the Beginning:  An Introduction to Programming with PowerShell


This video is a basic introduction to computer programming using the PowerShell language.  I hope it is helpful.


Tuesday, May 19, 2015

Developing Workflows in PowerShell


Workflow Foundation is a .Net framework for defining complex processes that can span a long period of time, can be stopped and restarted where they left off, support parallel execution of tasks, and can be packaged into reusable components.  Until PowerShell 3.0, workflows could only be created in Visual Studio using C# or VB .Net.  PowerShell 3.0 added support for the creation and execution of workflows. PowerShell workflows can be executed locally or on remote machines, thereby running parallel processes across multiple machines dramatically improving performance and scalability.  In Azure, PowerShell workflows are called Runbooks and can be used for a variety of tasks.

Note:  See the bottom of this blog for information on a free presentation I am doing tomorrow night!


PowerShell makes implementing workflows intuitive but misleading.  The workflow keyword is used to define a workflow similar to defining a function but a workflow is actually quite different.  The reason is that the cmdlets in a workflow are actually translated into the Workflow Foundation language and submitted for processing.  PowerShell is not running the code, Workflow Foundation is.   

To try the code samples below, you will need to start the PowerShell ISE which can be done as follows.  Click the Start Menu, select All Programs, open the Accessories folder, then the Windows PowerShell folder and run either Windows PowerShell ISE or Windows PowerShell ISE (x86).  The x86 indicates this is the 32 bit version whereas the other is the 64 bit version.


Once in the ISE, you can paste the code samples into the script window and click on the execute button (the green arrow in the toolbar) in the toolbar as shown below to execute the samples.


Let'e try a simple example of a workflow. Consider the code below which defines a workflow called simple.


workflow simple ([string] $myparm)

{

   "Parameter is $myparm"


   Get-Date


   "Some activity"


   "Third activity"

}

The code above defines a workflow but to call it, we need to execute the workflow as shown below.

workflow 'test'

We should see the output to the console below.  


Parameter is test


Sunday, May 17, 2015 4:03:07 PM

Some activity

Third activity

Notice the first keyword above, workflow, which is where we would normally see the word  function.  That's all it takes to create a workflow in PowerShell.  

However, behind the scenes there is more going on.  In an effort to make it easy for PowerShell developers to migrate to workflows, Microsoft added a cmdlet translator to PowerShell which is invoked via the workflow keyword.  Anything contained in the workflow code block is submitted to a translator which converts the code into the workflow language and submits it to the workflow engine to be processed.  This means there are some differences between what is supported in functions versus workflows.  

Let’s try some code that breaks the workflow engine to see this.  Consider the code below.

workflow simplebroken ([string] $myparm)

{

   Write-Host "Parameter is $myparm"


   $object = New-Object PSObject


   $object | Add-Member -MemberType NoteProperty -Name MyProperty -Value 'something'


   $object.MyProperty

}


simplebroken 'test' # Runs the workflow

When we run the code above, we get a number of error messages.  Why?  The answer is that only a subset of PowerShell cmdlets are mapped to workflow equivalents and Write-Host is not one of them.  Another problem is that each statement in a workflow runs as a separate process, called an activity, so we cannot define a complex object in one line, and access it from another.  Interestingly, simple variables such as strings can be accessed by multiple lines.  In fact, the workflow can be suspended and resumed and the variable values will be restored when the workflow restarts.  Complex objects cause problems because they can not readily be serialized to disk and restored.

There is a workaround for the lack of complex object support across activities.  We can use the workflow command inlinescript which will run a scriptblock as one activity.  Therefore, the lines in the script block can see any objects created in the script.  This is shown in the code below.

workflow simpleinline ([string] $myparm)

{
  inlinescript
  {
     Write-Verbose "Parameter is $Using:myparm"
  
     $object = New-Object PSObject

     $object | Add-Member -MemberType NoteProperty -Name MyProperty -Value 'something'

     $object.MyProperty
  }
}

simpleinline 'test' –Verbose  # Calls the workflow

Above, an object is created and a property added to it which is displayed.  Since it is all in the scriptblock, there is no problem.  Also notice, Write-Verbose is supported by workflows.

Now that we have a feel for workflows, let's look at code that uses the three workflow specific commands other than inlinescript. These are sequence, parallel, and foreach -parallel. 

workflow paralleltest {

 sequence
 {
  "1"
  "2"
  "3"
 }

 parallel
 {

   for($i=1; $i -le 100; $i++){ "a" }

   for($i=1; $i -le 100; $i++){ "b" } 

   for($i=1; $i -le 100; $i++){ "c" }

 }

  $collection = "one","two","three"

  foreach -parallel ($item in $collection)
  {
   "Length is: " + $item.Length
  }

}

paralleltest  # This statement calls the workflow

The first workflow command above is sequence which instructs the workflow engine to run the statements in between the braces sequentially.  This is followed by the parallel statement that tells the workflow engine to run each statement in between the braces in parallel, i.e. concurrently.  Lastly, we see the foreach -parallel statement which iterates over a collection running the code in between the braces in parallel.  This would most likely be used to iterate over a list of machine names submitting code to run remotely on those machines.  

The possibilities with workflows are endless and in a future blog we will discuss how to suspend a workflow for any period of time and resume it having it picked up where it left off.  Yes. Workflows can retain state and we'll learn all about that next time.

Tomorrow night, Wednesday, May 20, at 6:30 PM, I will be presenting a free in-depth presentation on PowerShell Workflows entitled Workflows for the Rest of Us.  You can reserve a seat at the link below.
http://www.meetup.com/The-RI-Microsoft-BIUG/events/222490566/

Just click on the 'Join Us' link and RSVP.  The presentation is free as is pizza and soda and there will be a number of items and swag given out.  Our group also does a lot of free webinars so even if you can't make this meeting, please join so you will be kept up to date.

Thanks,

Bryan